Top 13 SaaS KPIs: 2026 Benchmarks from Nordic Companies
16 June 2026

16 June 2026
How do Nordic B2B SaaS companies perform on the metrics that matter most? Viking Growth shares benchmark data from more than 15 portfolio companies, covering annual recurring revenue (ARR) growth, churn, CAC payback, NRR, and other key SaaS metrics.
Viking Growth invests exclusively in B2B SaaS, which gives us something most benchmarking reports don't have. We present real operating data from 15+ portfolio companies, tracked consistently from 2022 to 2025. The companies in our portfolio range from €3M to €100M ARR, with target markets spanning the Nordics, UK, Benelux, DACH, Spain, and the US.
This article walks through the KPIs we track across every company in the portfolio. What they mean, how to calculate them, and where Nordic SaaS companies actually land on each one.

Ingvild Farstad, Head of Operational Excellence at Viking Growth
First, we want to give a quick overview on the Viking Growth KPI Dashboard. The dashboard is divided into three sections to ensure we don’t discuss sub-optimal solutions.
Our Viking Growth KPI dashboard is the foundation for making data-driven decisions together with our portfolio companies. Each month, they report financial results and key SaaS metrics like annual recurring revenue (ARR) growth, churn, CAC payback and NRR, allowing us to track performance and benchmark progress over time.
At the center of the dashboard is the honeycomb, which provides a clear overview of company performance and helps us identify areas that require attention. It is a valuable tool not only for supporting our portfolio companies, but also for evaluating new investment opportunities.
By comparing potential investments with companies already in our portfolio, we gain a stronger basis for assessing performance, growth potential, and investment fit.
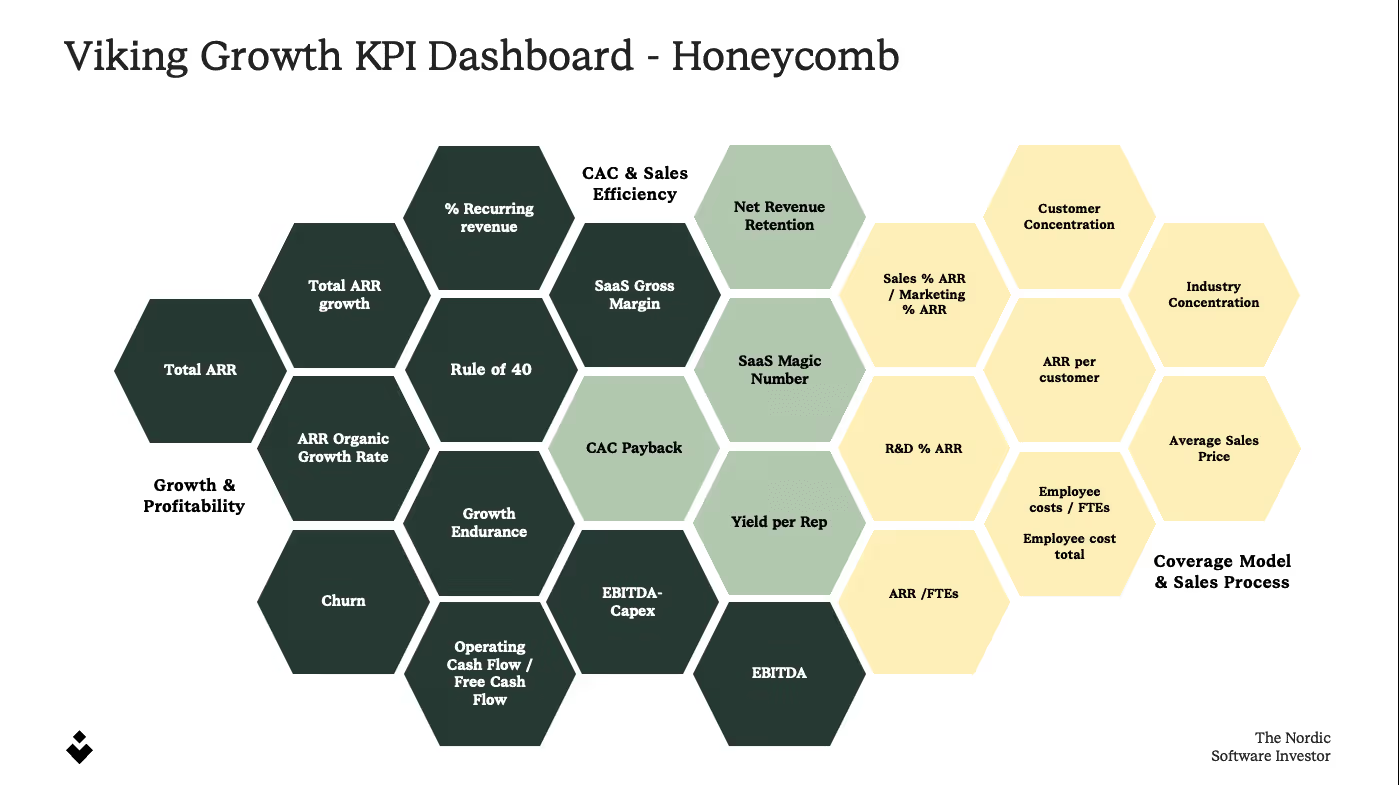
Let's take a deeper dive into the Viking Growth KPI Dashboard.
Please note that the portfolio benchmarks presented for 2022–2025 are based on the active portfolio in each respective year.
Download the ARR growth report
We find it very important to distinguish between organic and inorganic growth to understand the underlying drivers.
In the following sections, we review our Growth and Profitability KPIs. When evaluating these metrics, it is important to consider how SaaS valuation priorities have evolved.
The market has moved from a "growth at all costs" approach to a greater focus on balancing growth and profitability. While the weighting has shifted from roughly 6:1 to 1:1 and more recently to 2:1 in favour of growth, sustainable performance remains key. Companies with exceptional growth or profitability may still achieve premium valuations compared with more balanced peers.
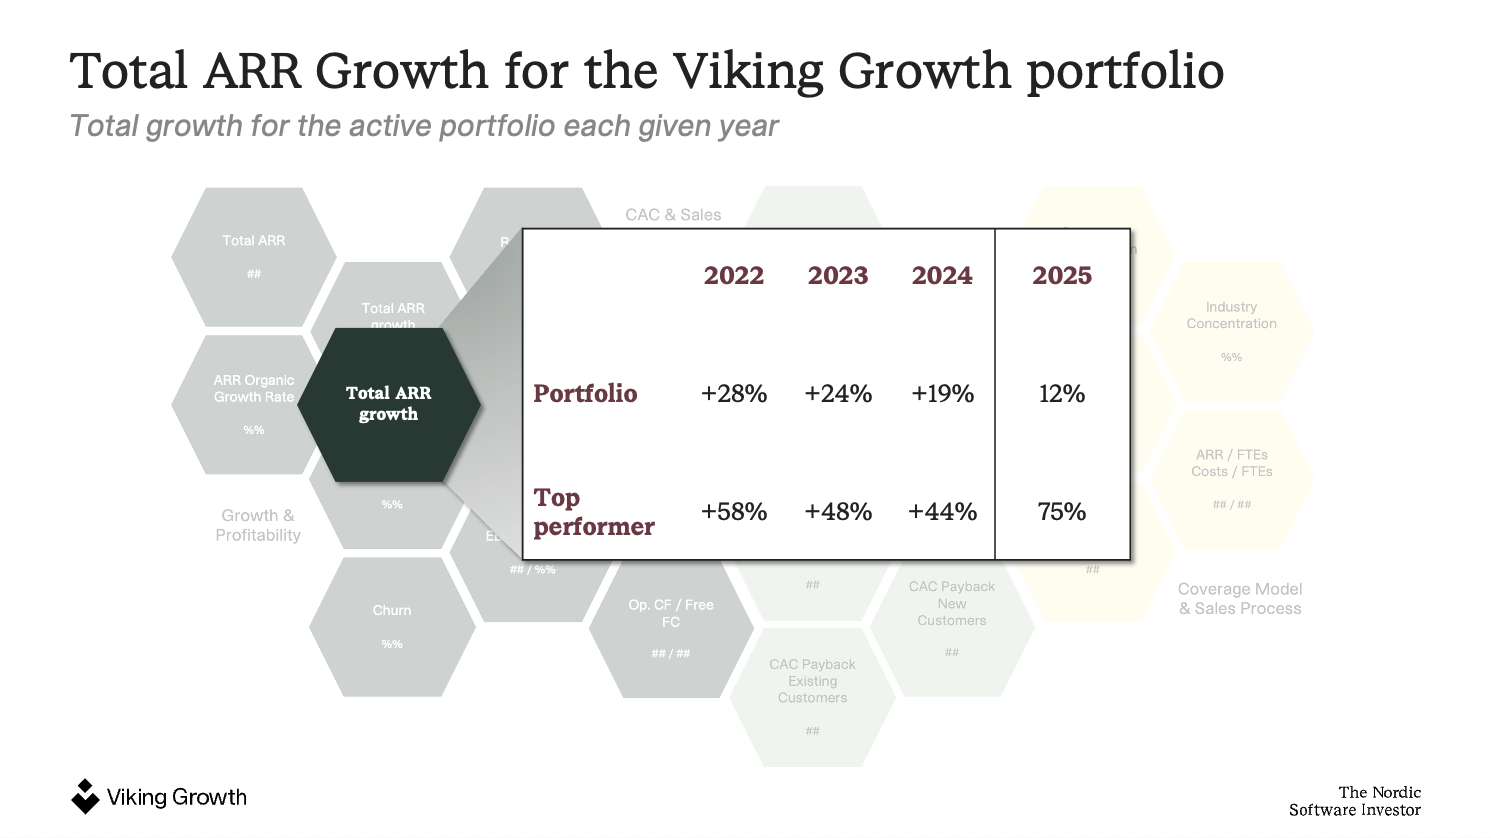
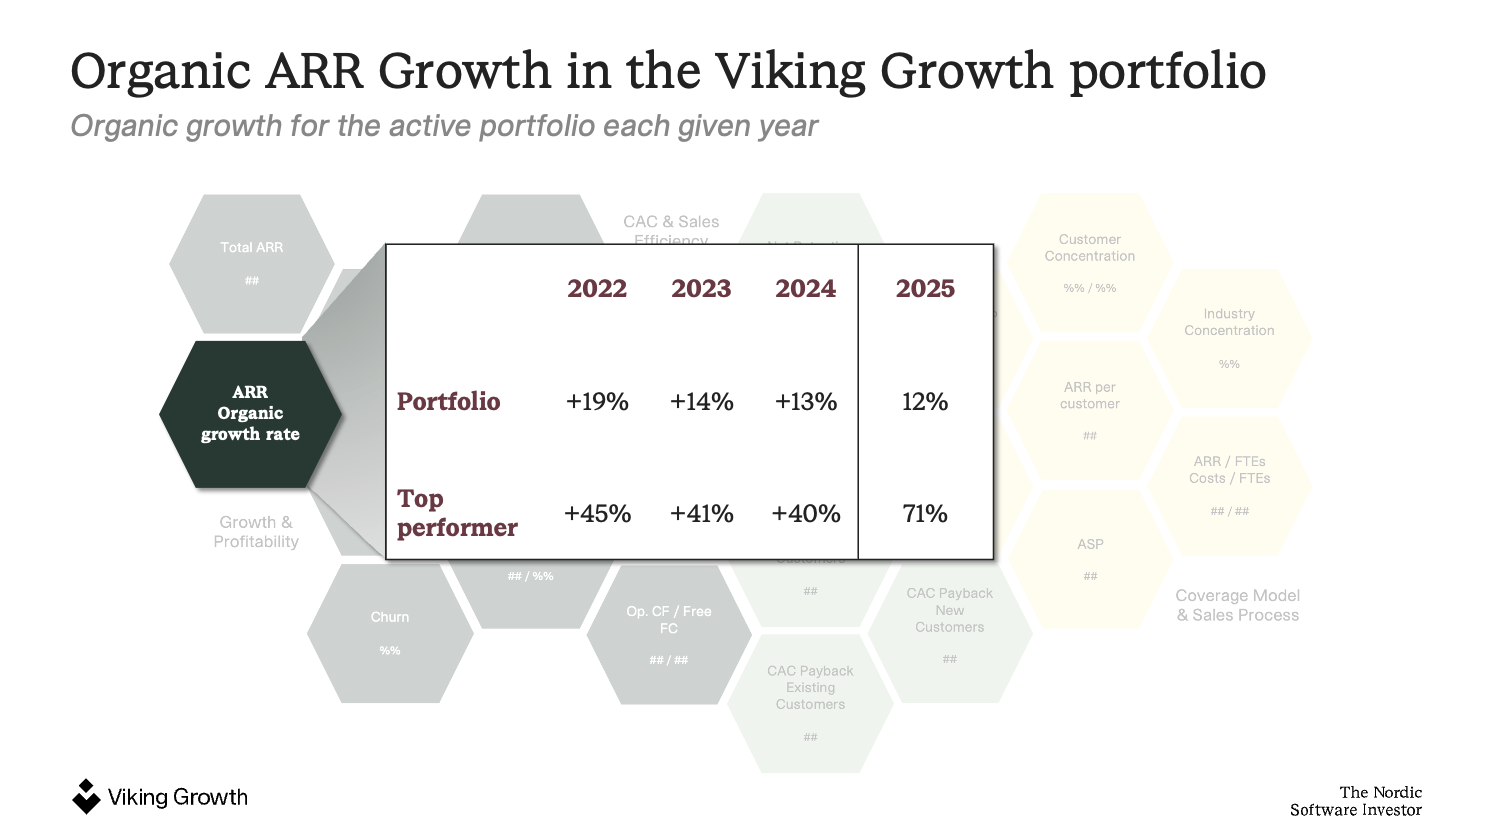
Across the Viking Growth portfolio, total ARR growth averaged 12% in 2025, including acquisitions. Organic growth also averaged 12%. The top performer grew 71% organically. For context, in 2020 portfolio organic growth sat closer to 30%, which is a reminder of how the market has repriced growth expectations since the pandemic peak.
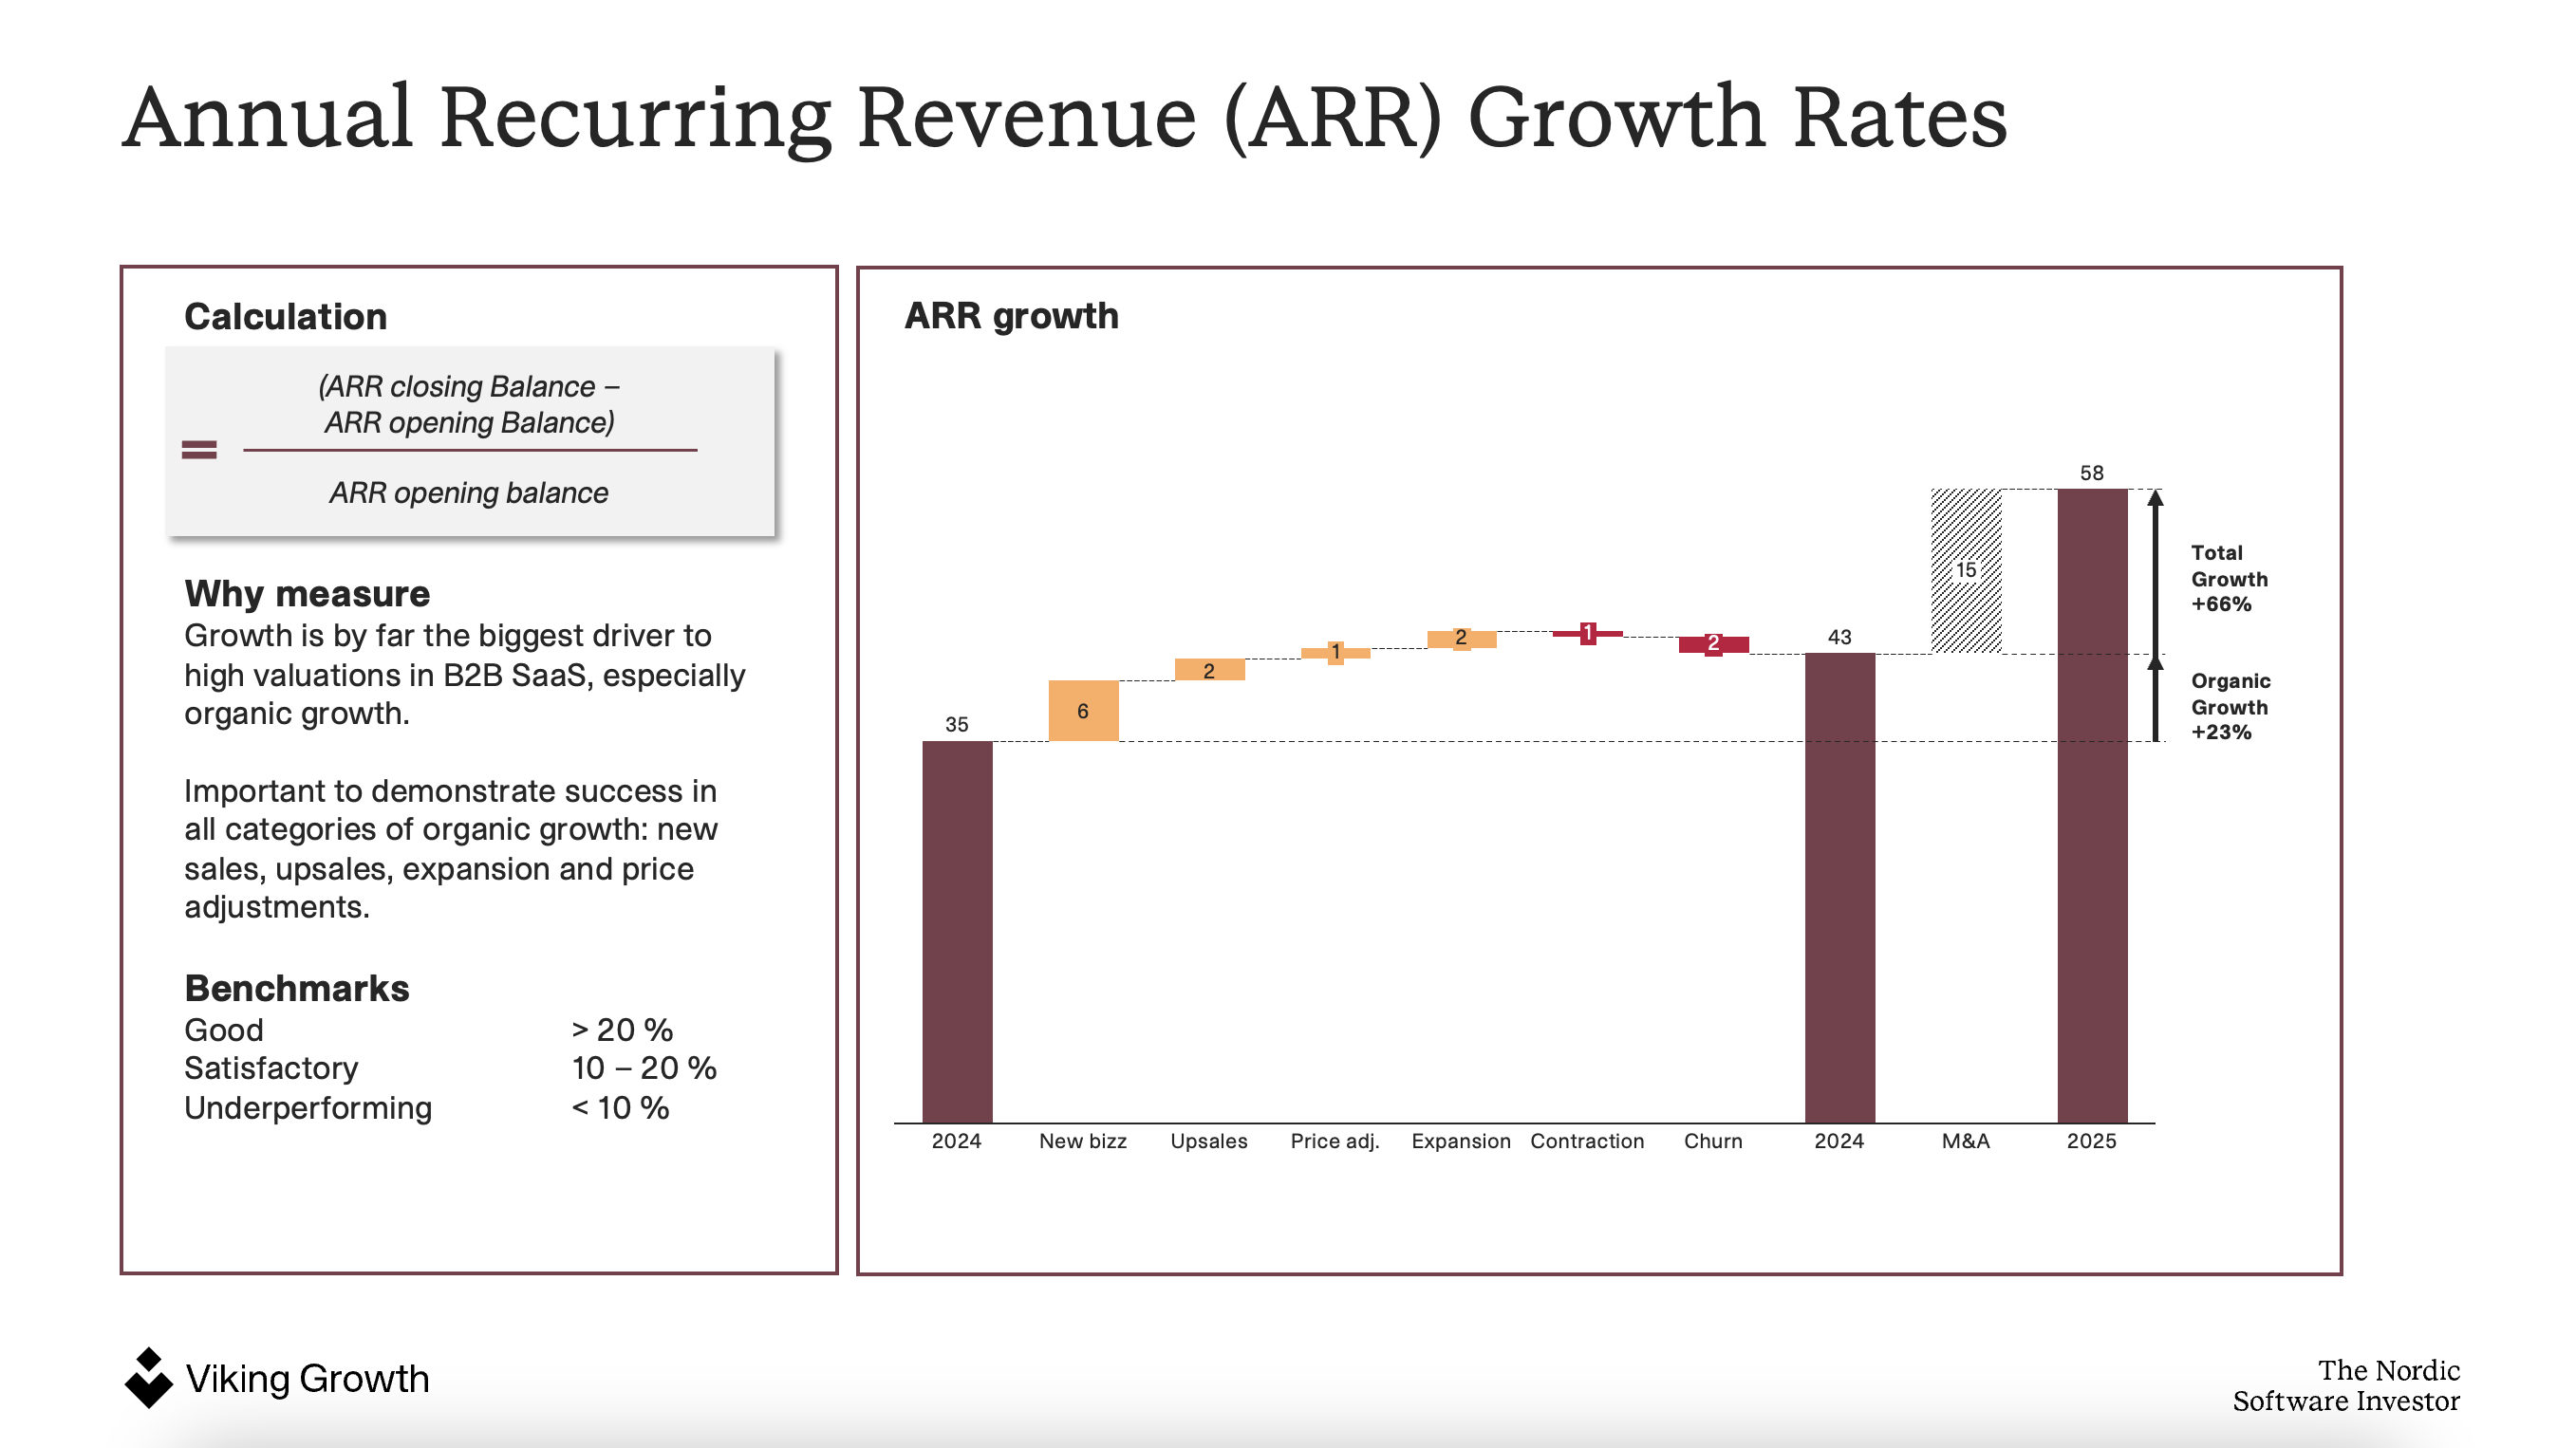
We are very fond of the ARR Waterfall model, which illustrates the ARR movements for new sales, up-sells, acquisitions, price increases, contraction, and churn. This overview gives us an understanding of how our companies leverage the different growth engines and how our top performing companies utilize all growth drivers. Check out our ARR Growth Report to see how this looks within the Viking Growth portfolio.
You can measure churn in terms of ARR and # of customers; both are important to measure and track. Knowing your churn is essential for forecasting but understanding why customers cancel their subscriptions is the real value. We have run several projects with our portfolio companies to understand the root causes of churn and improve the value proposition.
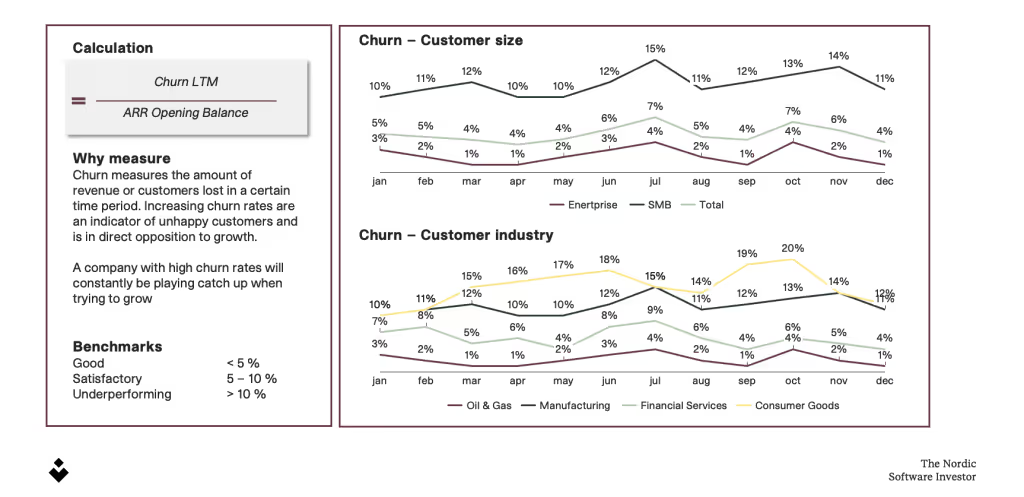
If you want to learn more about how to fight a high customer churn rate, look at our article on SaaS Churn: how to measure and reduce it. You need to know your churn, but make sure you also understand your Renewal Rate.
Churn might be artificially low if you include the total customer base rather than just the ones with contracts up for renewal. This especially applies to fast-growing companies or companies with customers on longer contracts. Many of your customers may be unable to churn even though they may wish to.
It is an excellent measure of customer satisfaction. It indicates healthy and profitable growth in the long term by telling us what percentage of our customer base actively chooses to renew their subscriptions when given a chance.
As mentioned, the current market conditions have resulted in a shift where investors are no longer looking for companies with a growth-at-all-costs mentality. They would rather see a more balanced view of growth and profitability.
It has also become apparent that choosing a clear profile, high growth, or high profitability is essential. You cannot waver in the middle.
Therefore, every business needs to understand the balance between growth and profitability. This KPI tells you whether you have found an optimal balance between growth and profitability.
If the sum of your organic growth rate and EBITDAC margin is 40%, you have reached an optimal balance between growth and profitability. Let’s look at some examples:
Within B2B SaaS, EBITDAC is widely accepted as a measure for Cash EBITDA, and more importance is being placed on this KPI as capitalization of R&D costs can vary greatly. Moreover, this is also why we differentiate between EBITDAC and EBITDA to ensure our companies don’t have an overstated view of profitability.
The Rule of 40 ensures our companies have a risk-adjusted growth profile, which helps us decide when to hit the accelerator and grab onto the brakes. Check out our article on Rule of 40 for a deeper walk-through.
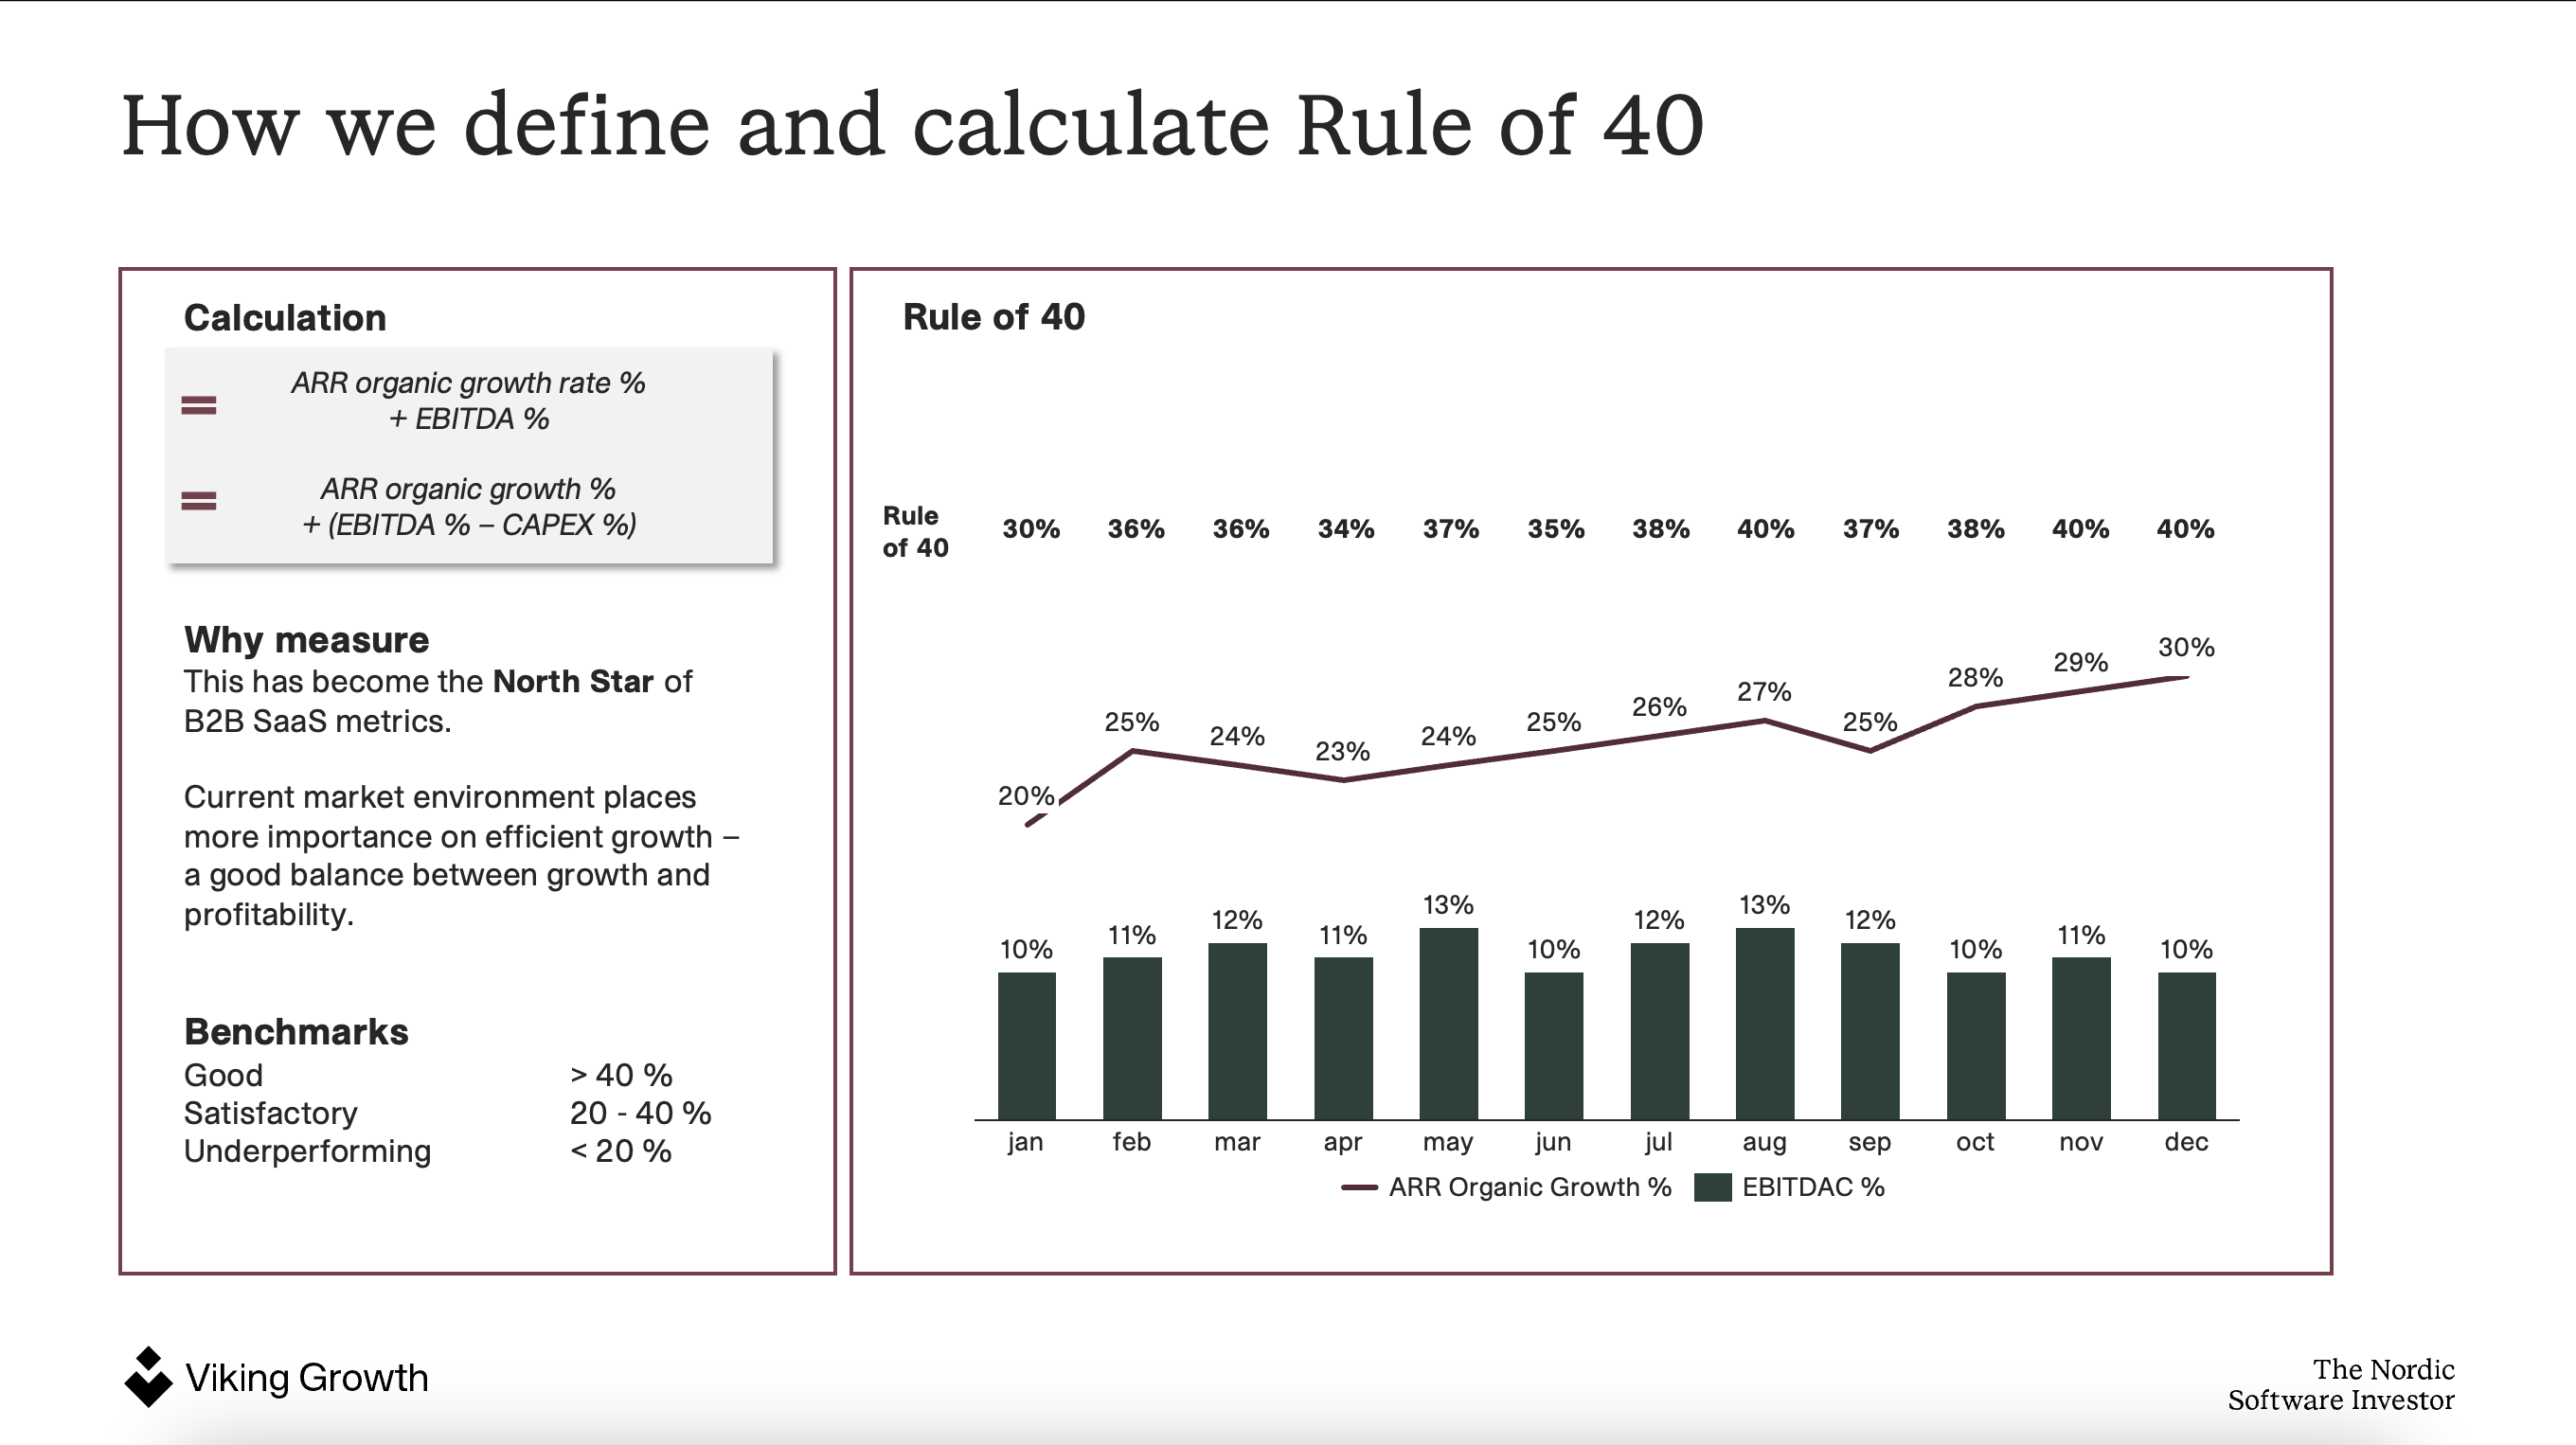
Among our portfolio companies, the distribution has shifted materially since 2021. In the growth-at-all-costs era, many companies scored above 40 purely on growth. Today the mix has rebalanced: we see companies with 20% organic ARR growth and 20% EBITDAC margin reaching 40 more sustainably than those growing 40% with zero profitability.
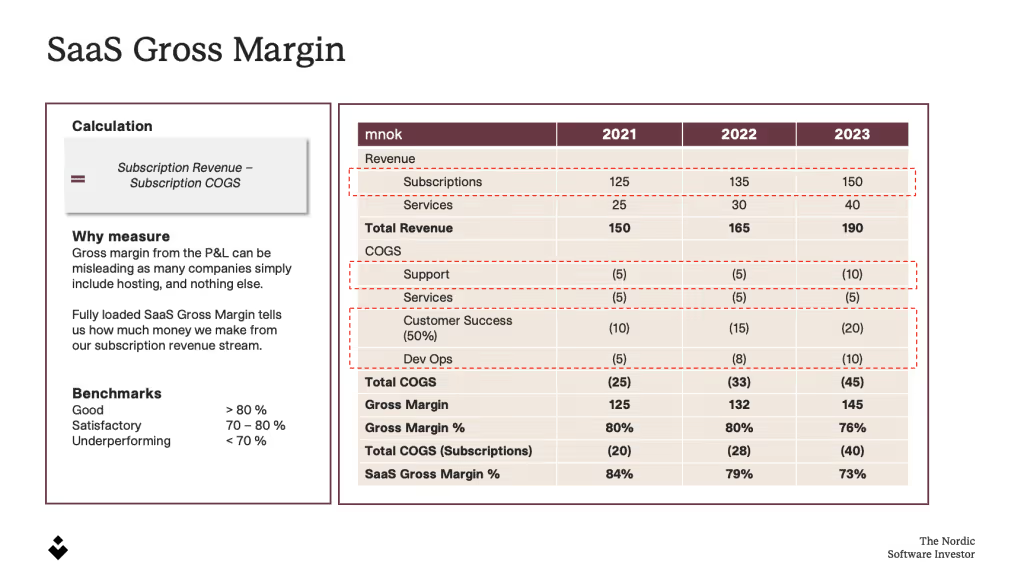
Traditional Gross Margin for software companies does not accurately show what the company retains of sales income after incurring all direct costs. Therefore, we need to adjust this to show SaaS Gross Margin. When broken down, this KPI helps a company understand its business’ scalability and can show which products/services contribute the most to the bottom line.
SaaS COGS = Cost of Goods Sold = All ‘variable costs’ attributed to delivery. These costs include all costs related to technical department and maintenance, which are the sum of both expensed and activated costs, third-party expenses, support, and other direct costs. You should also include costs attributed to the retention of current customers in the Customer Success department.
If you want to learn more about the KPIs for growth and profitability and how you can track progress, you can have a look at our previous article about 4 SaaS KPIs to improve growth and profitability.
As AI-related costs continue to rise, gross margins may come under pressure. Watch your SaaS burn rate alongside gross margin, if AI inference costs push burn up while ARR holds flat, the Rule of 40 score moves before the margin line does. To protect profitability, ensure your pricing reflects the value your product delivers.
In the following section, we will go through our CAC and Sales Efficiency KPIs:
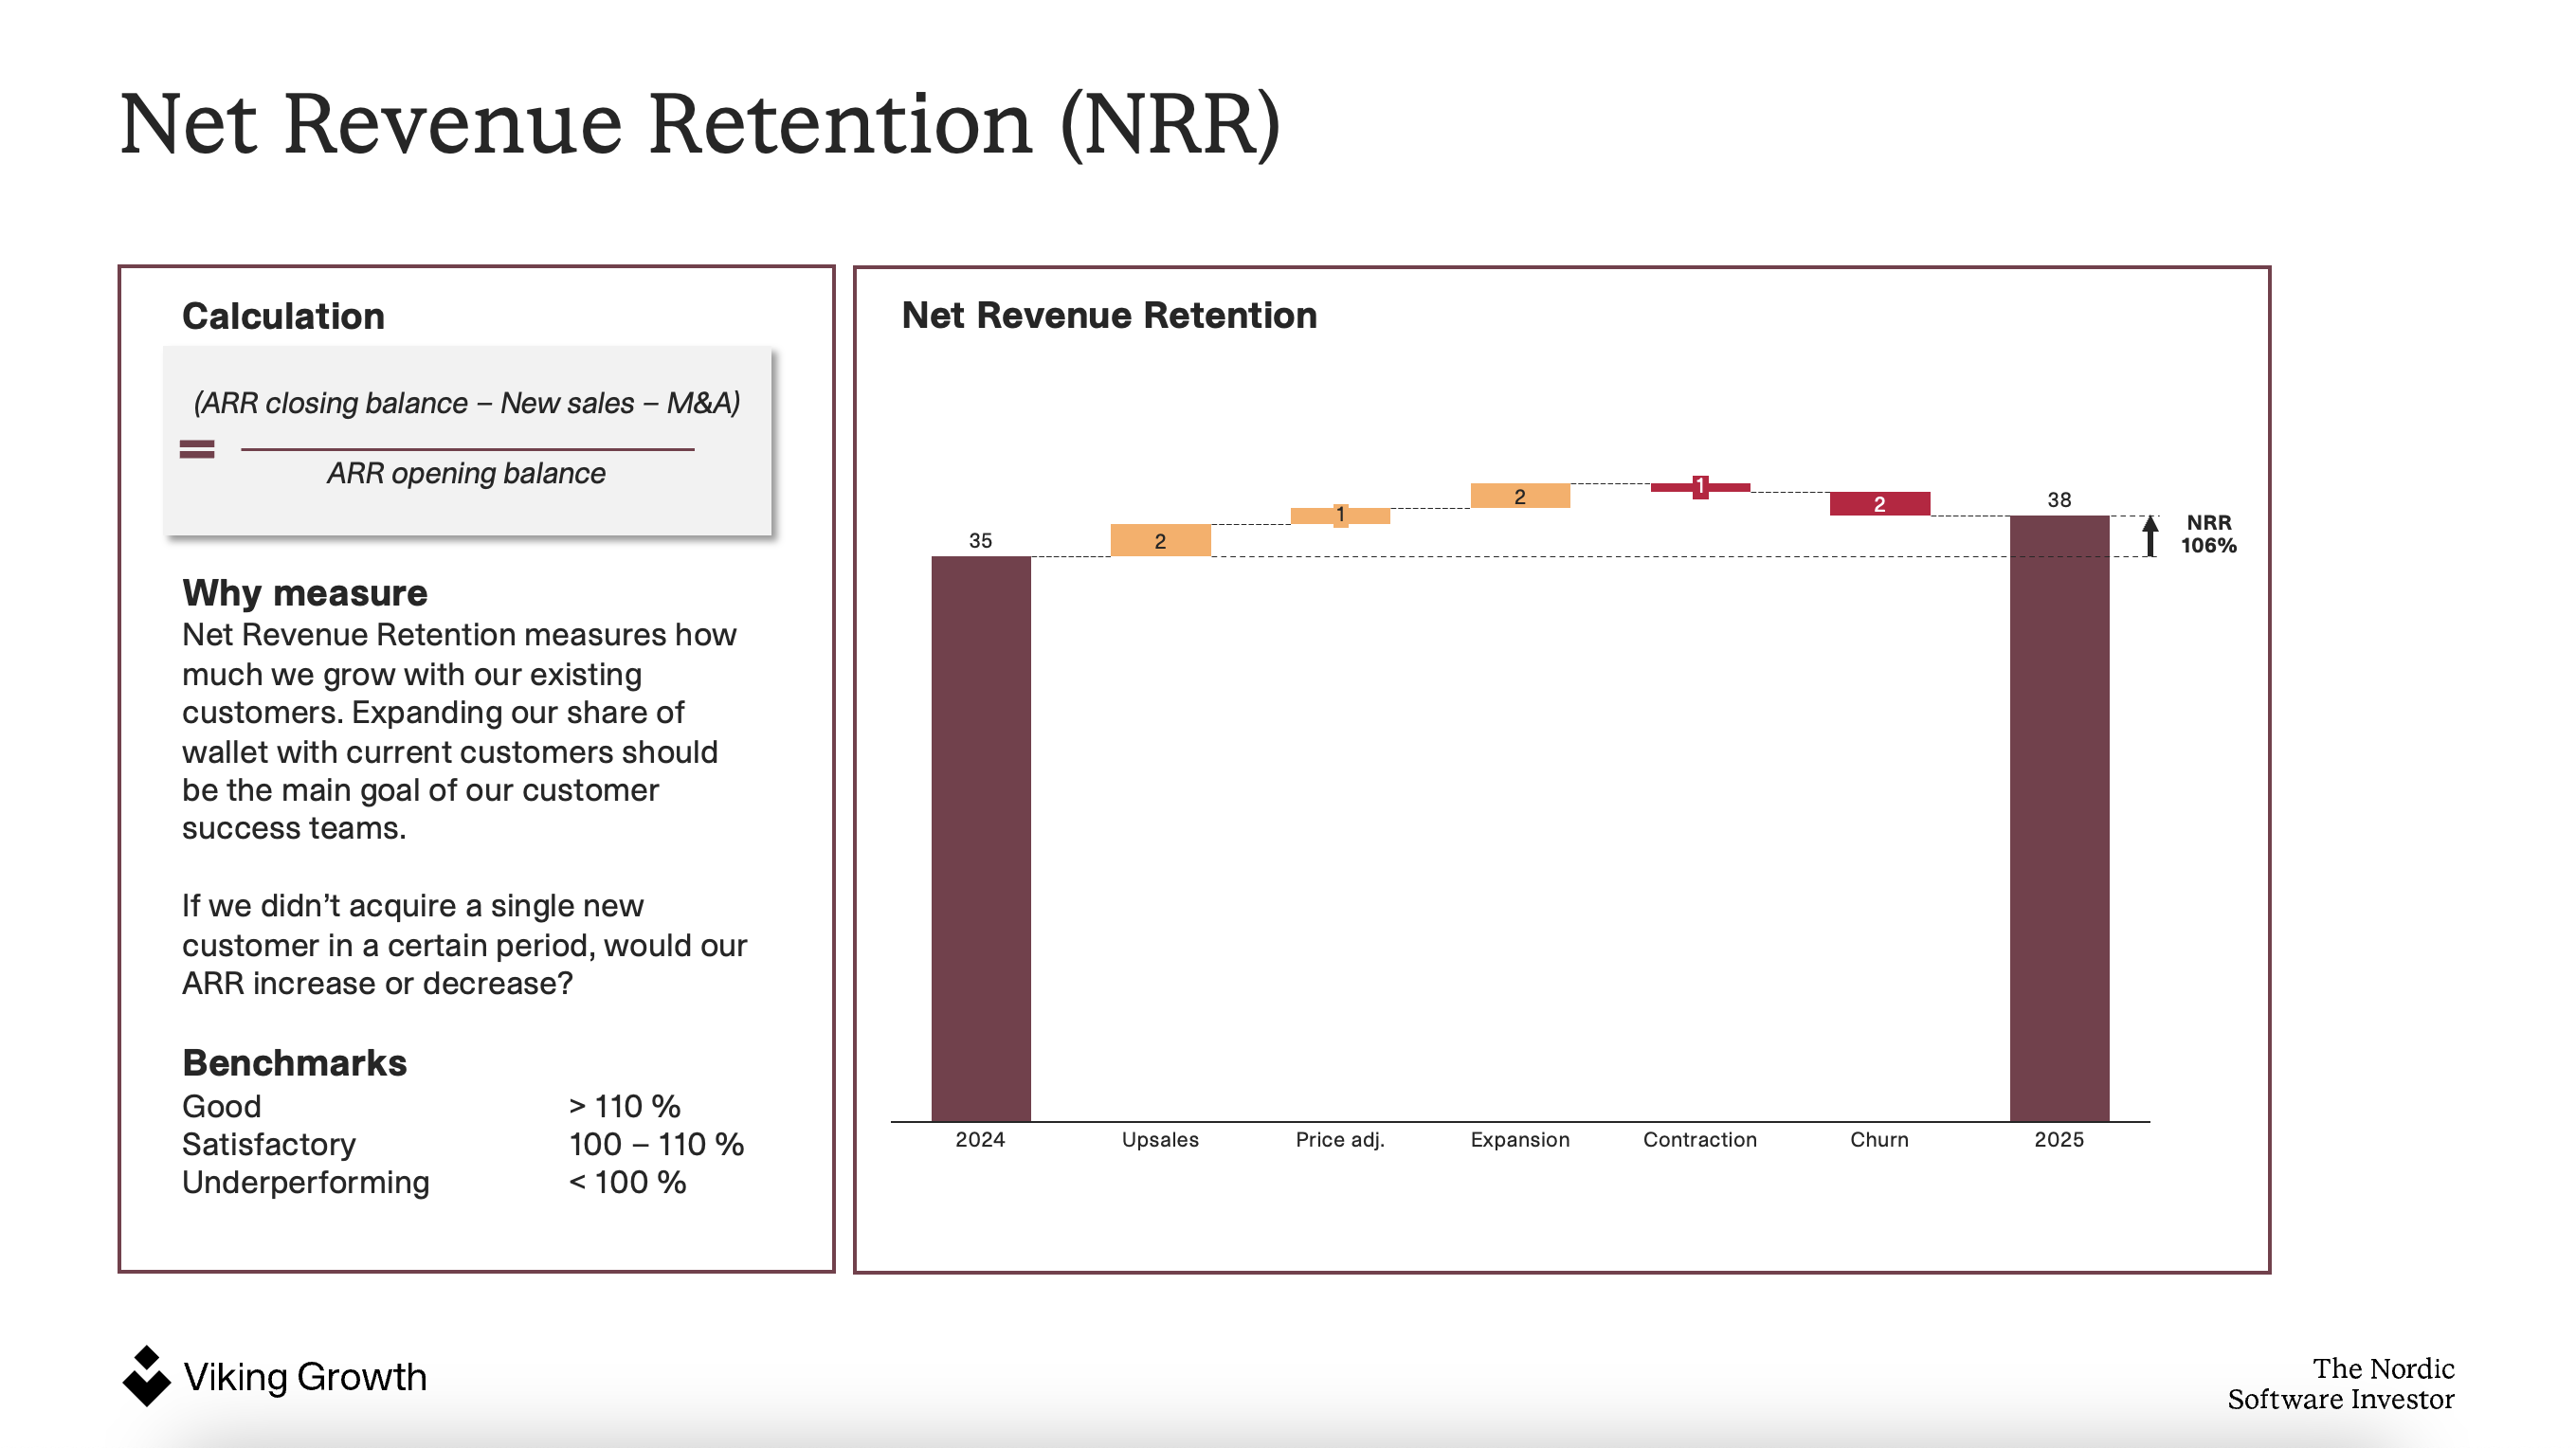
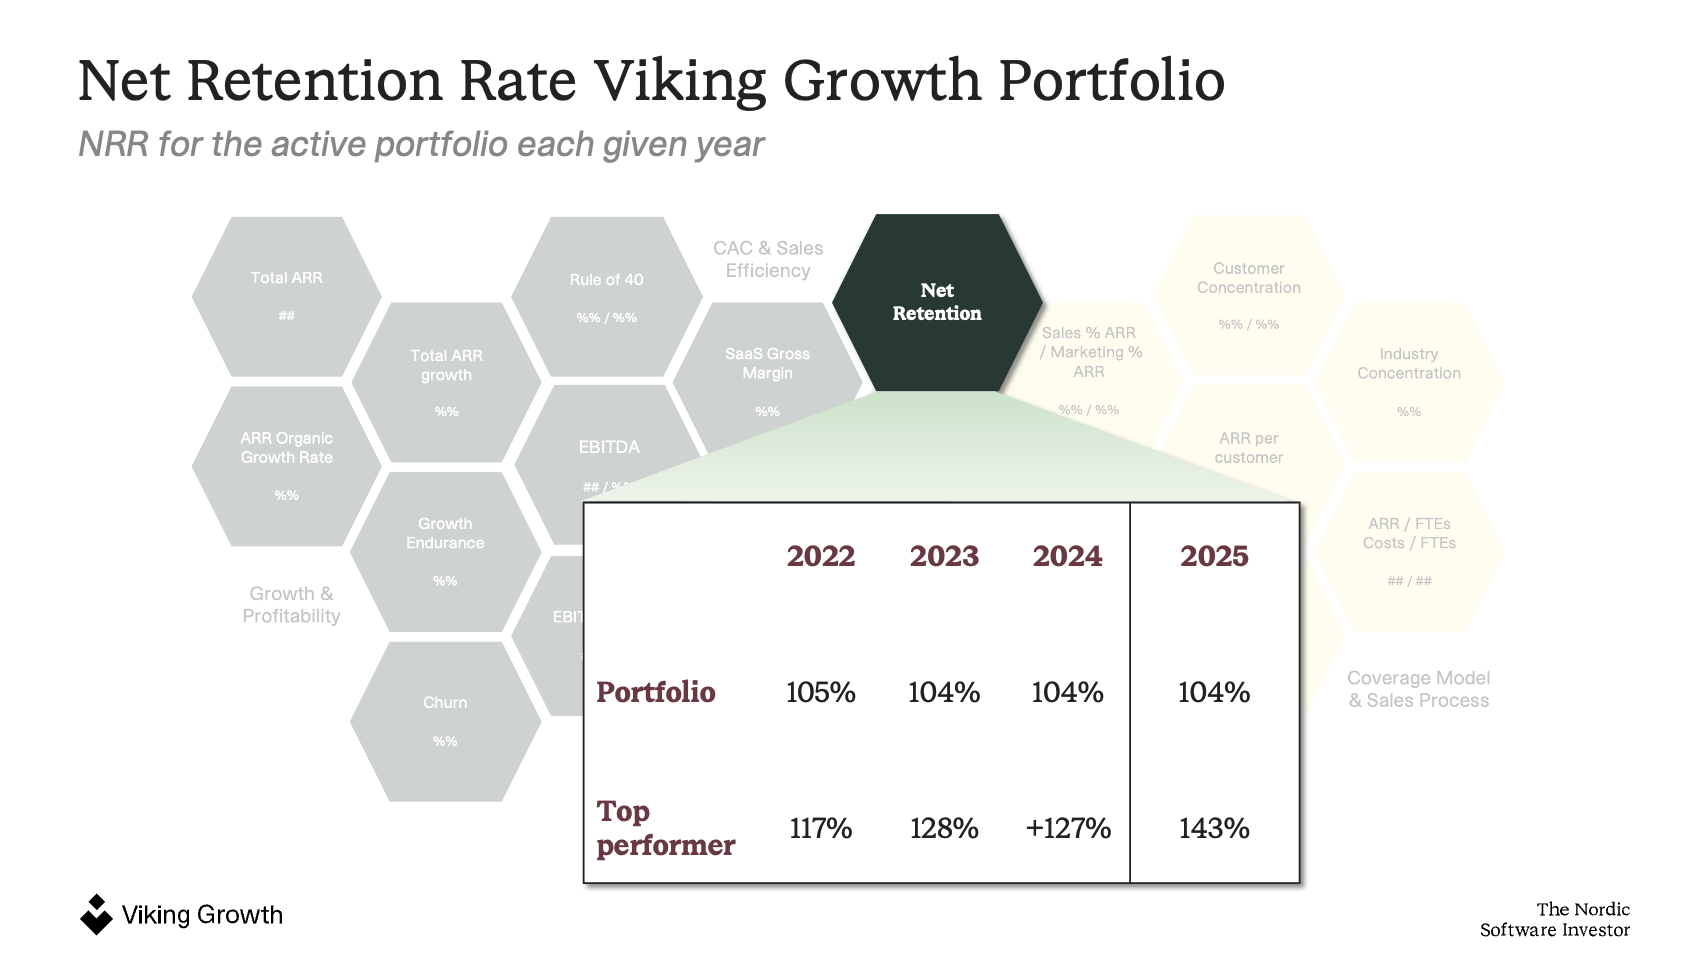
Net retention is known to be the most comprehensive metric as it tells the complete revenue story of the installed base of customers. This metric shows you what your company’s top-line revenue would be if you didn’t gain a new customer again. In other words, it captures the negative impact of lost customers and the positive impact of price changes, up-sells, and cross-sells.
In the Viking Growth portfolio, NRR above 100% signals that expansion revenue from existing customers is outpacing churn. Very strong B2B SaaS companies typically sit at 110–120% NRR. Below 90% is a warning sign that the installed base is shrinking, regardless of new sales performance. NRR is a lagging metric. To see expansion or contraction before it shows up in revenue, pair it with customer health score as the leading indicator.
We measure this because it is the primary KPI connected to sales scalability, and growth will require capital if the CAC payback is more than 12 months. When we segment this KPI based on customer type, we can focus our efforts on where we are the most effective.

A CAC payback above 12 months means growth requires continuous capital, where the business is funding its own sales cycle. Across our portfolio, the median sits around 15–18 months, with top performers below 12. When we segment by customer type, the variance is significant: enterprise deals often run 24+ months, while SMB-focused companies can get to under 9. Our latest webinar explains key SaaS valuation metrics.
In addition to the customer acquisition cost, we want to look at the Lifetime Value (LTV). The reason for this is simple: the lifetime value of a customer must be higher than the cost of acquiring that customer.

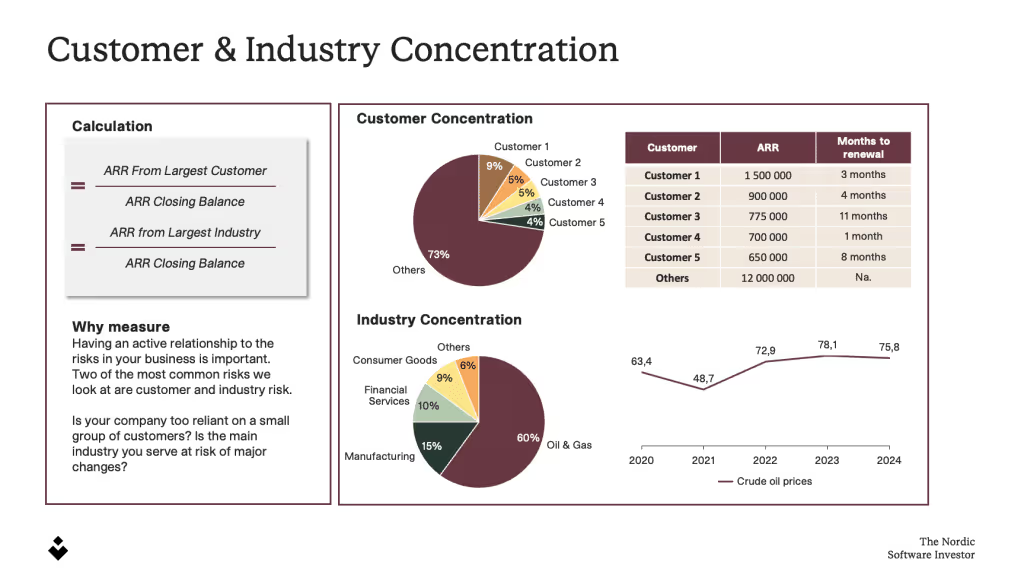
Customer concentration measures how total revenue is distributed among your customer base. High concentrations carry substantial risks for businesses. Losing a customer can devastate revenue, and customers have more influence on pricing and can divert a disproportionate share of resources.
When measuring this in the Viking Growth portfolio, we look at the ARR from the top 1 customer and top 10 customers of total ARR.
Keep in mind that some industries tend to have higher customer concentrations than others; for example, retail sales typically generate low concentrations, while industries with many enterprise players generate high concentrations.
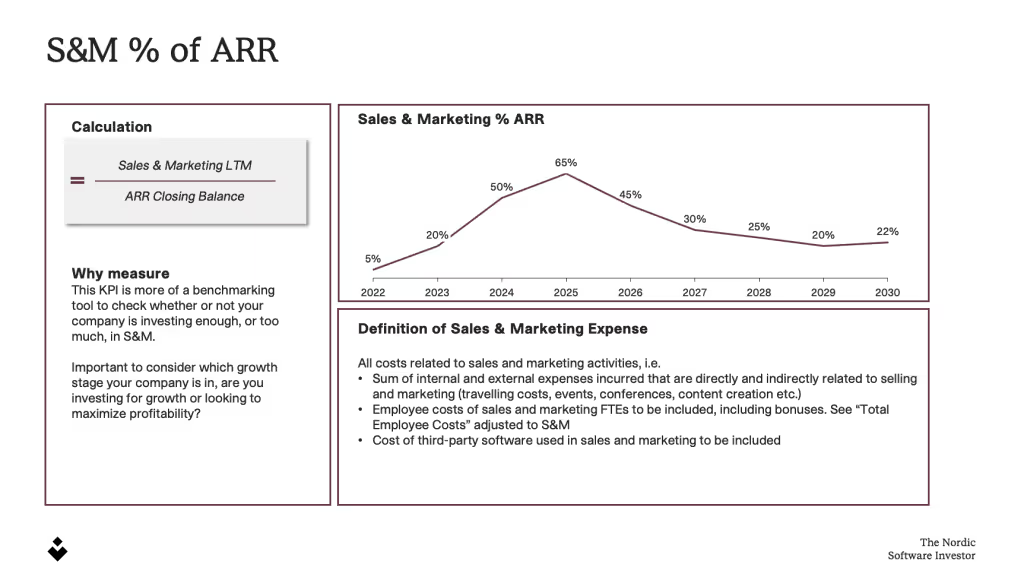
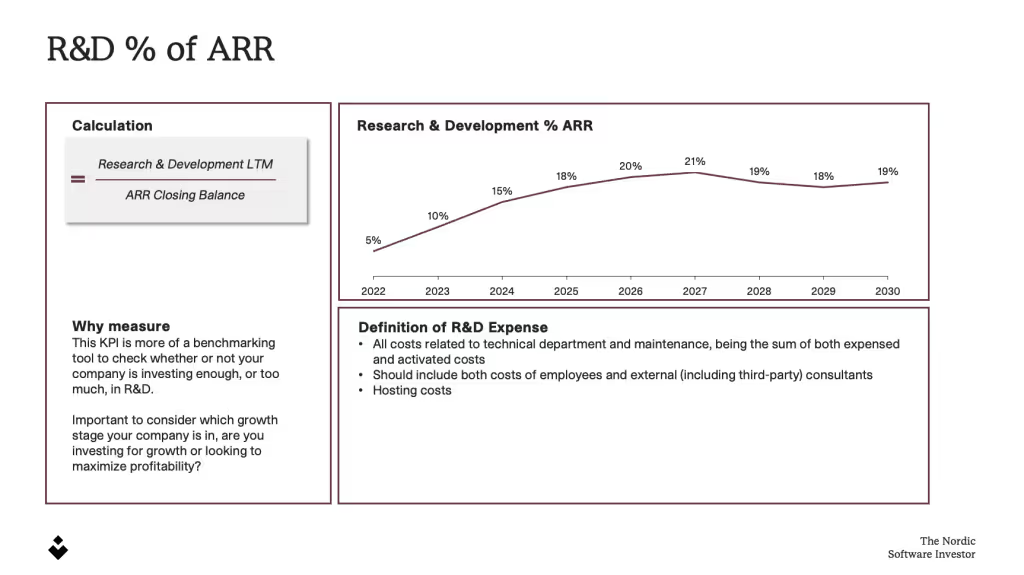
We measure this to understand how much our companies spend on product development and sales processes to continue growth. This KPI is especially interesting as a benchmarking exercise between the portfolio companies and up against the other KPIs we are measuring.
According to Insight Partners’ Periodic Table, the benchmark for these two KPIs is approximately 30% based on performance data across their private and public SaaS companies. Insight Partners is one of the leading software investors in the world and share a lot of great knowledge on their website.
How efficiently is your SaaS company growing? Tracking ARR per FTE and Total Employee Cost per FTE gives valuable insights into productivity and cost efficiency – how effectively are our companies working, and how do they compare to each other?
The companies pulling ahead in 2026 are not necessarily the fastest-growing. They are the ones who know exactly where they stand on ARR growth, NRR, CAC payback and gross margin to make better decisions faster. For the broader frame on what those better decisions actually look like in practice, see how to succeed with your SaaS growth strategy.
Compare your performance to our benchmarks with the SaaS KPI Cheat Sheet.

It depends on where you are in your growth journey. At €2–5M ARR, a higher organic growth is achievable and expected by investors. At €3–10M ARR, above 20% is strong. Across the Viking Growth portfolio, the average organic ARR growth in 2025 was 13%, with the top performer reaching 71% organically.
Above 100% means your existing customer base is growing on its own, through expansion, upsells, and price increases. That's the threshold every SaaS company should be targeting. Best-in-class companies in B2B SaaS typically run 110–120% NRR. Below 90% is a meaningful warning sign that needs addressing before you scale new customer acquisition.
The Rule of 40 is a benchmark for the balance between growth and profitability. Add your organic ARR growth rate and your EBITDAC margin. If the result is 40 or above, you're in a healthy zone. A company growing at 20% with a 20% EBITDAC margin scores the same as one growing at 40% with break-even profitability. The rule matters because it forces a clear strategic choice: high growth or high profitability. Companies stuck in the middle, with average scores on both, tend to struggle with valuation. Read our deeper analysis: Is the Rule of 40 an outdated SaaS KPI?
CAC payback is the number of months it takes to recoup what you spent acquiring a customer. If your CAC payback is above 12 months, every new customer requires capital to fund before they become profitable, which constrains how fast you can grow without external financing. Below 12 months means the business is more self-funding. Segment it by customer type: your enterprise CAC payback and SMB CAC payback will look very different, and mixing them together obscures where your sales efficiency actually lives.
Churn rate measures the share of all customers who leave. Renewal rate only looks at customers whose contracts are actually up for renewal. In fast-growing companies or those with multi-year contracts, many customers cannot churn even if they want to, which makes churn look artificially low. Renewal rate gives a more honest read on customer satisfaction and the health of your installed base.
Nordic B2B SaaS companies at growth stage (€3–10M ARR) track closely to global benchmarks on metrics like Rule of 40 and gross margin, but tend to have higher customer concentration and lower NRR than US counterparts at the same ARR level. This is partly a market structure effect: Nordic companies often start with a smaller total addressable market and need to internationalize earlier to drive NRR through upsell. Our KPI Dashboard data spans 19 companies across these ranges and market positions.
How do Nordic software companies scale globally? The Viking Growth newsletter shares actionable insights and strategies that show what really works.
Sign me up
Kongens gate 8, 7011 Trondheim
© Viking Growth 2025